IMF에서 GDP 관련 지표를 파이썬으로 얻어오기
2019-06-09 • quant • imf, gdp, nominal gdp, real gdp, potential gdp, gdp gap, python • 3 min read
IMF에서 세계 지표들을 확인할 수 있습니다. 이번 포스트에서는 파이썬으로 IMF 사이트에서 GDP 관련 지표들을 파이썬으로 얻어오는 방법을 다루겠습니다.
국제통화기금(IMF, International Monetary Fund)는 선진국들이 출자하는 펀드이며 세계 경제 지표를 조사하여 공개하고 있습니다. IMF에 대한 자세한 사항은 나무위키 - IMF를 참고하세요.
국내총생산(GDP, Gross Domestic Product)에는 명목 GDP(Nominal GDP)와 실질 GDP(Real GDP)가 있습니다. 명목 GDP는 당해의 시장가격으로 가치를 계산하고 실질 GDP는 물가를 고려한 가격으로 가치를 계산합니다. 따라서 경제성장률은 실질 GDP의 성장률을 의미합니다. 한국의 GDP는 나라지표 사이트에서 확인할 수 있습니다.
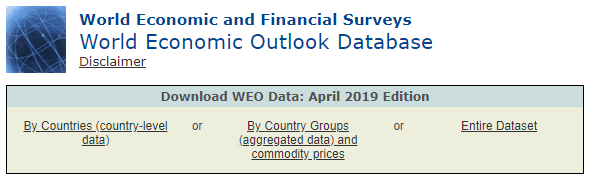
한국 뿐만 아니라 세계 주요 국가들의 GDP 관련 지표들을 확인해 보겠습니다. IMF - World Econimic Outlook Databases에서 최신 발표 내용을 확인하면 됩니다.
먼저 By Countries (country-level data)를 선택합니다.
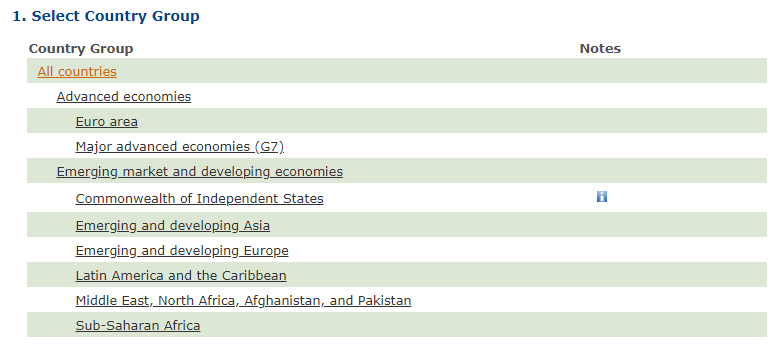
그리고 데이터를 얻고자 하는 국가를 선택합니다. 여기서는 모든 국가를 선택하겠습니다.
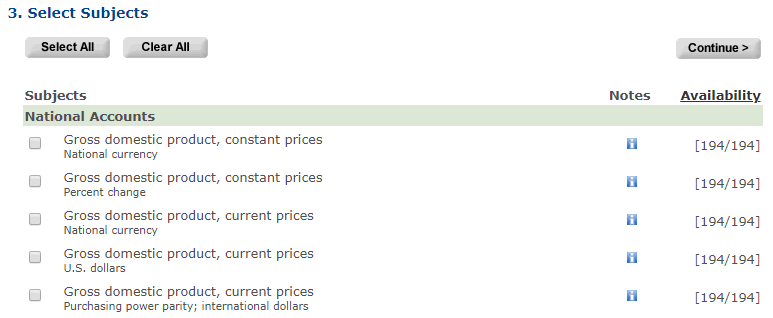
다음으로 얻고자 하는 데이터 종류를 선택합니다. 이 포스트에서 확인하고자 하는 데이터는 Gross domestic product, constant prices (Percent change)와 Output gap in percent of potential GDP (Percent of potential GDP)이긴 하지만 전체 다 선택하겠습니다.
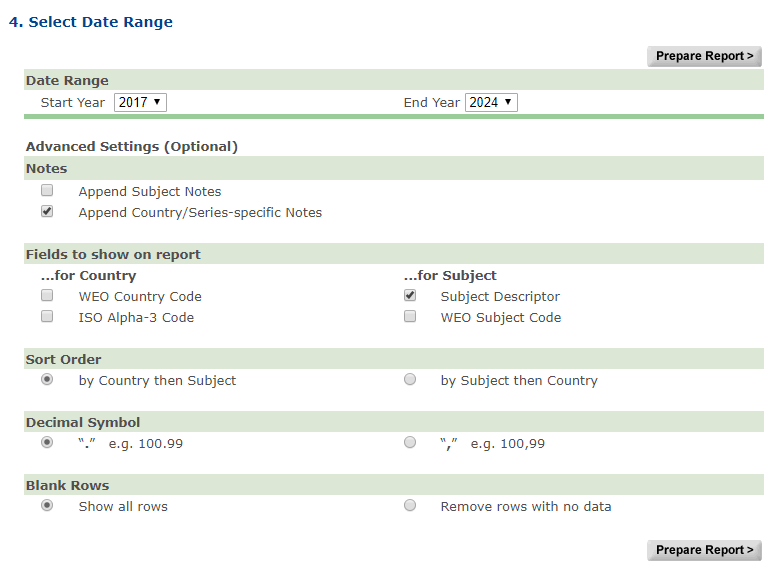
이제 다음 화면에서 Start Year를 1980으로 변경하고 나머지는 기본 설정으로 둔 상태에서 Prepare Report 버튼을 누릅니다.
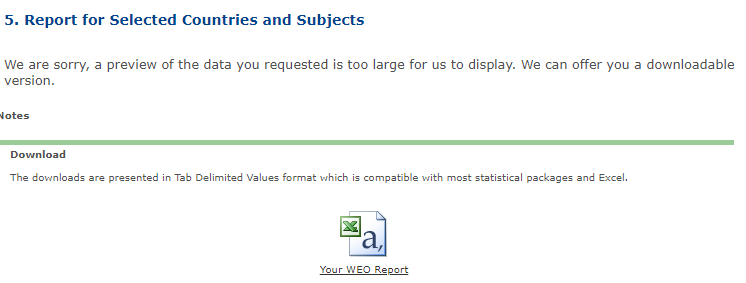
조금 기다리면 다음과 같은 화면이 나옵니다. 화면에 표시하기에 데이터가 너무 크다는 문구가 나오는데, 그 아래에 다운로드 링크가 있습니다. 이 링크를 클릭하면 WEO_Data.xls 파일을 다운받을 수 있습니다. 이 파일은 사실 TSV(Tab-separated Values) 입니다.
이제 파이썬으로 이 파일을 다운받고 읽어 보겠습니다. 먼저 다음처럼 requests 라이브러리를 사용해서 IMF 데이터를 요청하고 파일을 저장합니다.
import requests
url = 'https://www.imf.org/external/pubs/ft/weo/2019/01/weodata/weoreptc.aspx?pr.x=49&pr.y=15&sy=1980&ey=2024&scsm=1&ssd=1&sort=country&ds=.&br=1&c=512%2C668%2C914%2C672%2C612%2C946%2C614%2C137%2C311%2C546%2C213%2C674%2C911%2C676%2C314%2C548%2C193%2C556%2C122%2C678%2C912%2C181%2C313%2C867%2C419%2C682%2C513%2C684%2C316%2C273%2C913%2C868%2C124%2C921%2C339%2C948%2C638%2C943%2C514%2C686%2C218%2C688%2C963%2C518%2C616%2C728%2C223%2C836%2C516%2C558%2C918%2C138%2C748%2C196%2C618%2C278%2C624%2C692%2C522%2C694%2C622%2C962%2C156%2C142%2C626%2C449%2C628%2C564%2C228%2C565%2C924%2C283%2C233%2C853%2C632%2C288%2C636%2C293%2C634%2C566%2C238%2C964%2C662%2C182%2C960%2C359%2C423%2C453%2C935%2C968%2C128%2C922%2C611%2C714%2C321%2C862%2C243%2C135%2C248%2C716%2C469%2C456%2C253%2C722%2C642%2C942%2C643%2C718%2C939%2C724%2C734%2C576%2C644%2C936%2C819%2C961%2C172%2C813%2C132%2C726%2C646%2C199%2C648%2C733%2C915%2C184%2C134%2C524%2C652%2C361%2C174%2C362%2C328%2C364%2C258%2C732%2C656%2C366%2C654%2C144%2C336%2C146%2C263%2C463%2C268%2C528%2C532%2C923%2C944%2C738%2C176%2C578%2C534%2C537%2C536%2C742%2C429%2C866%2C433%2C369%2C178%2C744%2C436%2C186%2C136%2C925%2C343%2C869%2C158%2C746%2C439%2C926%2C916%2C466%2C664%2C112%2C826%2C111%2C542%2C298%2C967%2C927%2C443%2C846%2C917%2C299%2C544%2C582%2C941%2C474%2C446%2C754%2C666%2C698&s=NGDP_R%2CNGDP_RPCH%2CNGDP%2CNGDPD%2CPPPGDP%2CNGDP_D%2CNGDPRPC%2CNGDPRPPPPC%2CNGDPPC%2CNGDPDPC%2CPPPPC%2CNGAP_NPGDP%2CPPPSH%2CPPPEX%2CNID_NGDP%2CNGSD_NGDP%2CPCPI%2CPCPIPCH%2CPCPIE%2CPCPIEPCH%2CFLIBOR6%2CTM_RPCH%2CTMG_RPCH%2CTX_RPCH%2CTXG_RPCH%2CLUR%2CLE%2CLP%2CGGR%2CGGR_NGDP%2CGGX%2CGGX_NGDP%2CGGXCNL%2CGGXCNL_NGDP%2CGGSB%2CGGSB_NPGDP%2CGGXONLB%2CGGXONLB_NGDP%2CGGXWDN%2CGGXWDN_NGDP%2CGGXWDG%2CGGXWDG_NGDP%2CNGDP_FY%2CBCA%2CBCA_NGDPD&grp=0&a='
res = requests.get(url)
if res.status_code == 200:
    with open('data/2019-06-09-imf_gdp/WEO_Data_2019.xls', 'wb') as fout:
        fout.write(res.content)
그리고 저장된 파일을 pandas 라이브러리를 사용하여 읽고 활용합니다. 확장자가 xls이기는 하지만 실제 내용은 TSV 형태이므로 read_csv() 함수를 사용할 수 있습니다.
그리고 저장된 파일을 pandas 라이브러리를 사용하여 읽고 활용합니다. 확장자가 xls이기는 하지만 실제 내용은 TSV 형태이므로 read_csv() 함수를 사용할 수 있습니다.
import pandas as pd
df = pd.read_csv('data/2019-06-09-imf_gdp/WEO_Data_2019.xls', sep='\t', encoding='ISO-8859-1')
df.head()
| Country | Subject Descriptor | Units | Scale | Country/Series-specific Notes | 1980 | 1981 | 1982 | 1983 | 1984 | ... | 2016 | 2017 | 2018 | 2019 | 2020 | 2021 | 2022 | 2023 | 2024 | Estimates Start After |
|---|---|---|---|---|---|---|---|---|---|---|---|---|---|---|---|---|---|---|---|---|
| Afghanistan | Gross domestic product, constant prices | National currency | Billions | Source: National Statistics Office Latest actu... | NaN | NaN | NaN | NaN | NaN | ... | 493.073 | 506.215 | 517.858 | 533.394 | 552.063 | 574.127 | 599.933 | 629.880 | 664.452 | 2017.0 |
| Afghanistan | Gross domestic product, constant prices | Percent change | NaN | See notes for: Gross domestic product, consta... | NaN | NaN | NaN | NaN | NaN | ... | 2.164 | 2.665 | 2.300 | 3.000 | 3.500 | 3.997 | 4.495 | 4.992 | 5.489 | 2017.0 |
| Afghanistan | Gross domestic product, current prices | National currency | Billions | Source: National Statistics Office Latest actu... | NaN | NaN | NaN | NaN | NaN | ... | 1,318.478 | 1,377.535 | 1,418.128 | 1,488.861 | 1,595.053 | 1,733.539 | 1,902.109 | 2,096.951 | 2,322.650 | 2017.0 |
| Afghanistan | Gross domestic product, current prices | U.S. dollars | Billions | See notes for: Gross domestic product, curren... | NaN | NaN | NaN | NaN | NaN | ... | 19.428 | 20.235 | 19.585 | 19.990 | 20.682 | 21.928 | 23.577 | 25.450 | 27.608 | 2017.0 |
| Afghanistan | Gross domestic product, current prices | Purchasing power parity; international dollars | Billions | See notes for: Gross domestic product, curren... | NaN | NaN | NaN | NaN | NaN | ... | 66.384 | 69.449 | 72.648 | 76.158 | 80.470 | 85.426 | 91.113 | 97.643 | 105.158 | 2017.0 |
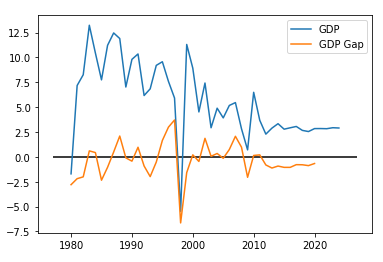
여기서 한국의 GDP 성장률과 GDP Gap 데이터만 뽑아서 차트로 가시화해보면 다음과 같습니다.
df_gdp = df[(df['Country'] == 'Korea') & (df['Subject Descriptor'] == 'Gross domestic product, constant prices') & (df['Units'] == 'Percent change')].iloc[:, 5:-1]
df_gdpgap = df[(df['Country'] == 'Korea') & (df['Subject Descriptor'] == 'Output gap in percent of potential GDP') & (df['Units'] == 'Percent of potential GDP')].iloc[:, 5:-1]
x_gdp = df_gdp.columns.astype(int)
y_gdp = df_gdp.values[0].astype(float)
x_gdpgap = df_gdpgap.columns.astype(int)
y_gdpgap = df_gdpgap.values[0].astype(float)

import matplotlib.pyplot as plt
import matplotlib
%matplotlib inline
plt.plot(x_gdp, y_gdp, label='GDP')
plt.plot(x_gdpgap, y_gdpgap, label='GDP Gap')
plt.hlines(0, xmin=x_gdp[0]-3, xmax=x_gdp[-1]+3)
plt.legend()